

Guide
Yumbo 103: Make sense of your nutrition
Your meals are data. Today, Graphs and Insights turn them into charts and plain answers about your health, and teach you a lot along the way.
5 min read 5item160 XP
In Yumbo 102 you learned to log a meal with SeeFood. Now the good part: what all those meals tell you.
Every meal you log is a data point. One of them doesn't say much. A few weeks of them say a lot: what you actually eat, not what you think you eat, where your energy comes from, which vitamins keep running low, and whether you're heading toward your goal or drifting away from it. Most of us have never seen our eating laid out like that. Once you do, it's hard to unsee.
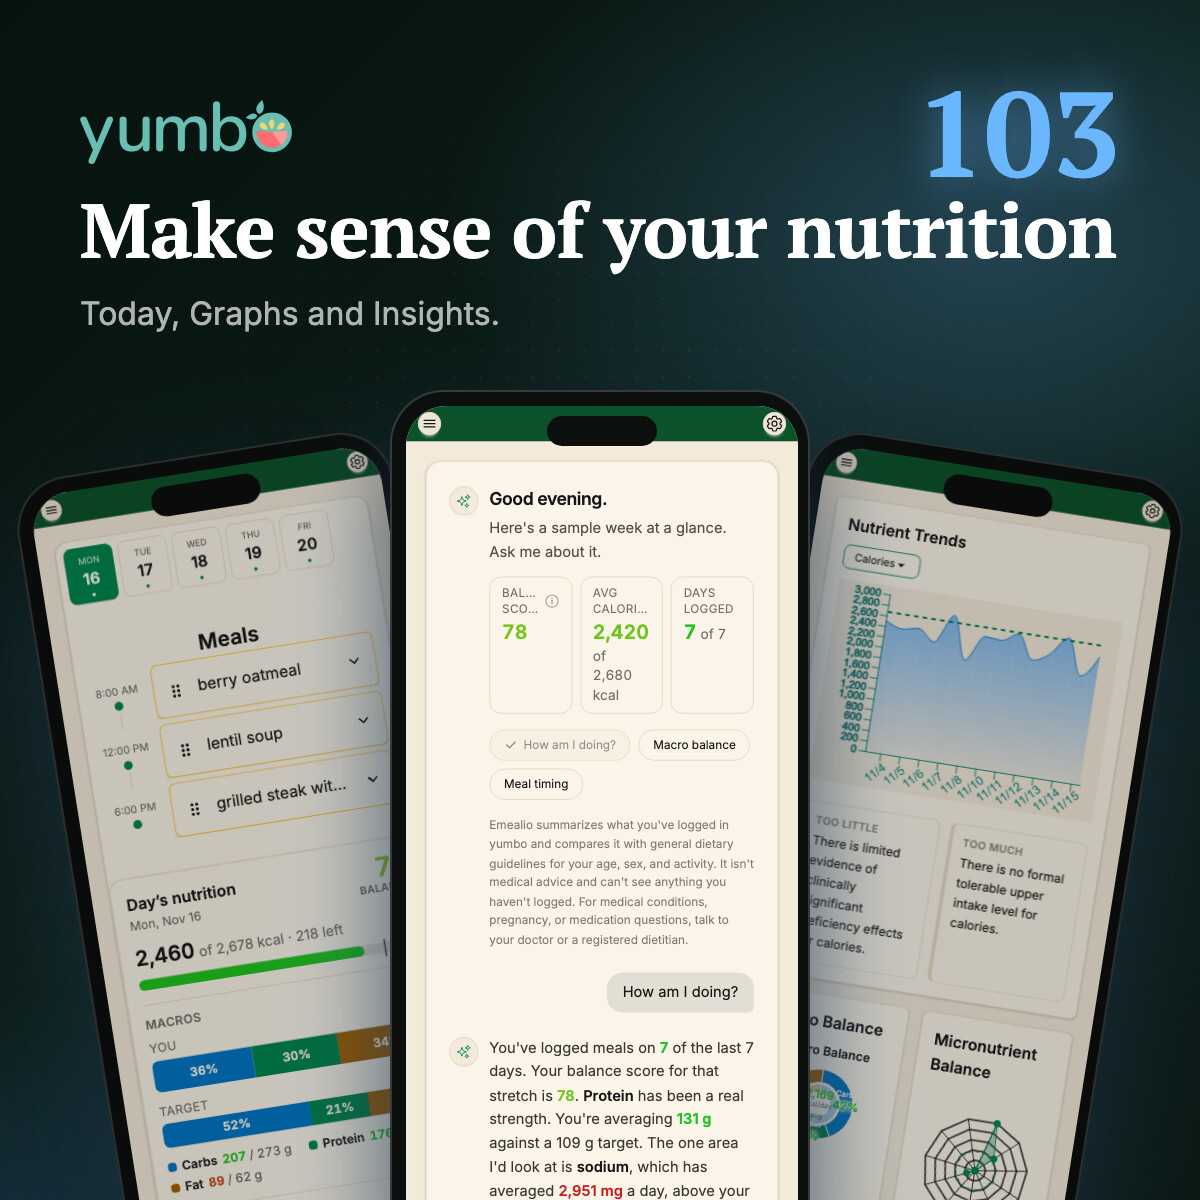
Yumbo shows it to you three ways: Today for the day you're in, Graphs for the trends, and Insights for plain answers. All three are in the menu (swipe right).
Today: the day at a glance
Today is the home screen. Across the top, the days of the week: tap one to see it. Below that, your meals in order, with a slot for each meal time and + Add a meal for anything extra. Tap a meal to open it.
Scroll down to Day's nutrition. It tells you how many calories you've eaten, how many you have left, and how your carbs, protein and fat compare with your targets. The number in the corner is your balance score: how well the whole day lines up with what your body needs, not just the calories.
Use it during the day, not just at the end. Seeing how many calories you have left before dinner is a lot more useful than finding out you went over after.
Graphs: the trends
A single day is noisy. One big dinner or a skipped lunch doesn't change much. What matters is the pattern, and that's what Graphs is for. Pick a date range at the top and every chart on the page redraws for it.
Start with Nutrient Trends. Pick any nutrient from calories to vitamin D and see it day by day against your target. Try it on two sample weeks:
Then see how it all fits together. Macro Balance shows where your calories come from. Micronutrient Balance puts your vitamins and minerals on one chart, so the ones that fall short jump out. Macro Trend stacks it day by day.
Keep scrolling and there's more. Food Group Balance checks your vegetables, grains and protein against healthy eating guidelines. Where Your Nutrients Come From shows which foods bring in the most of any nutrient, so you know exactly where your sodium or saturated fat is coming from. Tap the ? beside any chart to learn what it shows.
Insights: just ask
Charts are great when you know what you're looking for. Insights is for when you don't. Pick a time period at the top, then ask a question like "Am I on track for my weight goal?" Emealio, Yumbo's nutrition guide, answers from your own meals in plain words, with the numbers that matter highlighted and a chart to back it up.
Every answer comes with follow-up questions, so you can keep digging: which nutrients you're low on, what your eating could be doing to your body, what to change first. Here's one on a sample fortnight:
Free looks back over your last 7 days. Premium can look back as far as a whole year. For the full tour, see the Insights post.
Learn as you go
The best part isn't any one chart. It's what you pick up from looking at them every week. You learn which foods actually bring the protein, that your "light" lunch was the saltiest meal of the day, that your weekends look nothing like your weekdays. Nobody has to lecture you. Your own data does the teaching.
And the more you log, the sharper the picture gets. So keep snapping.
Quest
5item160 XPAnswer all 3 questions to earn the reward.